
Utilities rely on a combination of advanced data systems to better serve customers every day. These resources include Geographic Information Systems, Advanced Meter Infrastructure, and specialized grid analytic engineering software, which work jointly to provide the user with the electric system’s health, status, and usage.
In February, the Grand Haven BLP hosted a workshop presented by Robert Shelley, Distribution & Engineering Manager, with residents and business owners to help community members learn how the utility leverages this data and how they can also use these tools. You can view this presentation online at the BLP’s YouTube channel.
“The data available to our customers is powerful,” said Shelley, “Once you learn how to use these tools, you can uncover some key insights into how you use power every day, and what household electronics and appliances have the most impact on your utility bill.”
Where’s the Data Coming From?
The BLP manages a distribution system of nearly 15,000 meters covering 22.2 square miles.
“A network of four substations, 13 miles of high-voltage transmission lines, 112 miles of overhead lines, and 73 miles of underground lines requires careful planning and maintenance,” said Shelley.
Over the years, the technology and software available for electrical distribution management have grown substantially. In alignment with the BLP’s strategic plan, the utility has invested carefully in systems with a proven record of improving reliability and service for customers. These systems include:
• Geographic Information Systems (GIS) – GIS provides advanced, multi-layer mapping software that helps the BLP know where its assets are located and situated near homes and other critical infrastructure.
• Advanced Metering Infrastructure (AMI) – the BLP installed new customer meters systemwide that record usage and outage data in 15-minute increments and feed this information into other utility and customer-facing systems.
• Advanced Grid Analytics (AGA) – This engineering software integrates GIS and AMI and serves as an engineering tool to study the system performance and can then proactively prevent issues like equipment overloads. AGA can also monitor for under and overvoltage occurrences. The BLP can use AGA to work with customers in energy waste reduction programs, integration of customer-owned distributed generation resources or to evaluate the impacts of new loads on distribution system assets.
How Customers Can Benefit
Customers benefit from these integrated systems through increased reliability, faster diagnosis and repair during outages, and more efficient billing. In addition, the following are associated tools that customers can access to make their utility experience better.
Outage Management Center
The BLP hosts a real-time outage monitoring map online, accessible from the ghblp.org homepage. Here, customers can see if an outage in their area has already been reported, view the extent of the outage, and also quickly provide outage details that may be helpful to our System Operators and Linemen.
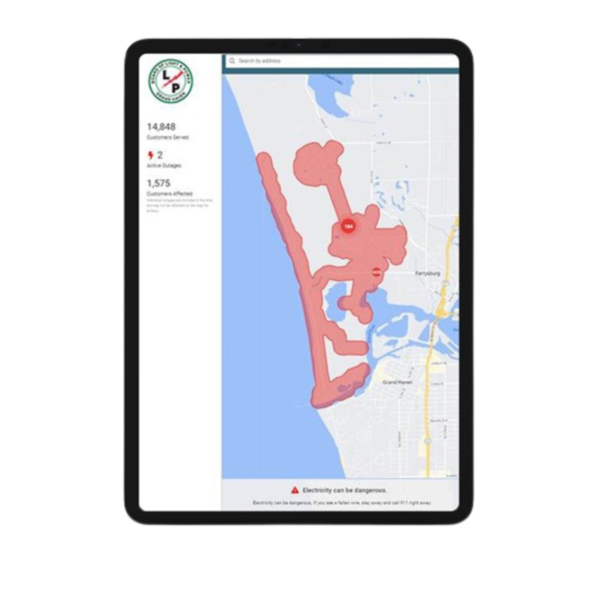
“Customers should use the outage management system to report outage information whenever possible,” said Shelley. “Sometimes folks want to use
social media or our website’s general contact forms to reach out during an outage, but it’s important to note those resources will not reach the dispatch team in a timely manner.”
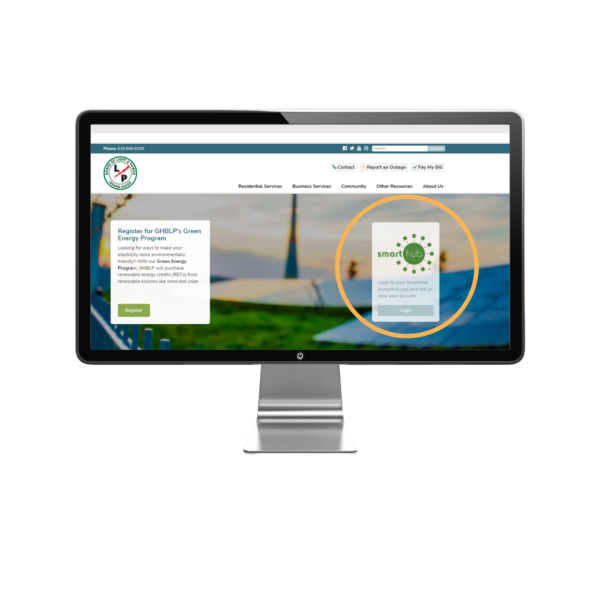
SmartHub Customer Portal
SmartHub is an interactive online portal where customers can view and pay bills, review usage history, and learn how weather and appliances affect their usage. It is accessible from the ghblp.org homepage or downloads the FREE app for Apple® and Android® devices.
During February’s training workshop, Shelley demonstrated how to update billing settings and contact information, sign up for paperless billing, receive email notifications, and how to review usage using SmartHub.
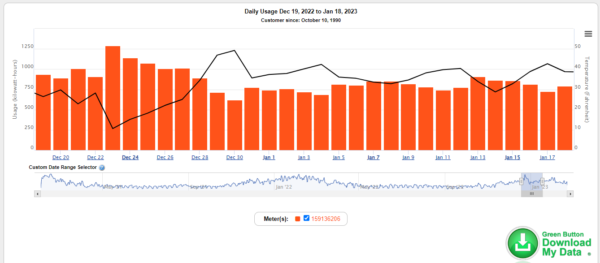
SmartHub enables customers to view usage over time and identify electrical “peaks” that they can tie back to a specific occasion. Using a view that shows daily temperatures mapped against daily usage allows customers to see how air conditioning and heating are used during high or low temperatures.
Shelley also explained how larger commercial and industrial customers can leverage SmartHub information. This is especially important for larger power users because they have a “demand charge” that is based on peak power draws for any given 15-minute increment. Demand charges ensure the BLP has the properly sized infrastructure in place to handle these higher demands.
By identifying and reducing peaks, businesses can reduce their costs. For example, if a business runs multiple pieces of high-wattage equipment at the same time, the peak energy necessary for those could be costing them more than if this equipment were run at separate times.
How to Get Started
For customers interested in setting up a SmartHub account, registration is simple and located right at the top of the ghblp.org homepage. Be sure to have a recent bill at hand for necessary identity information.
If you need assistance, please contact our Customer Account Representatives at 616-846-6250 Monday-Friday from 7:30 AM-5:00 PM.
")
